1.
Abstract-Sustainable tourism development in the Serengeti-Mara region seemingly depends largely on the wildebeest migration phenomenon. This is particularly due to its appeal to the tourist and its classification as one of the new wonders of the world by UNESCO. The phenomenon has over the years been used as a flagship/marketing tool to project the ecosystem as a leading tourism destination. This has resulted in proportionate flow of tourist to the region to witness this unique occurrence. Development of facilities to meet demands of tourists has also grown in tandem. However, continuity/persistence of the phenomenon has not been interrogated. Environmental management, resource use practices & other human activities on either side of the Kenya-Tanzania boundary have begun to alter the spectacular nature of the migration. Eventually, this trend may truncate the phenomenon altogether. This questions sustainability of tourism development. The main objective of this study was to assess the role of the wildebeest migration phenomenon in sustainable tourism development in the MSE. This was done by interrogating continuity of the phenomenon from a transboundary resource use and management perspective. Thematically, the migration phenomenon was looked at from its spectacular features namely; the migration route, population/numbers, migration pattern/season & timing and composition of the migrating community. The intention was to assess the relationship between these features and tourism development in the region. The study was guided by Rational Choice Theory and Tragedy of Commons Theory. Among the concepts explored included Political Ecology, Transboundary Natural Resource Management, Integrated Natural Resource Management and the concept of sustainability. A questionnaire was used to collect primary data from the field.
A pilot survey at Lake Nakuru National Park was used to test reliability of the research instrument. The research instrument was also subjected to scrutiny by subject matter experts to determine content validity. The target population for the study was 14983 individuals drawn from conservation agencies employees, business community and local community members. A strata sample size of 221 was obtained using coefficient of variation from Nassiuma's formula. The sample size was adjusted upwards based on response rate from the pilot survey to cater for nonresponse during the main study.
Based on this, an adjusted sample size of 339 was adopted I. Introduction a) Background to the Study look at the world map reveals a patchwork of independent states which was a result of colonial powers subdivision of continents into states for easy governance. The subdivision resulted in much of the natural resources and ecosystems lying astride boundaries between or among countries. This situation of shared resources and ecosystems has today called for territorial integrity as a principle to govern the relations between and/or among governments in order to avoid conflicts in resources utilization (see Braack et al. 2006). There exists multiple phenomena associated with transboundary wildlife resources, management of which has proved challenging. An elaborate example is that of wildlife migration, particularly Long Distance Migration (LDM).
2. i. Long Distance Migration of Animals
Long distance migration of animals is one of earth's dazzling biological phenomena. This eyecatching phenomenon has over the years attracted many scholars trying to understand how, why and when animals migrate. Long-distance migrations, where there is a seasonal movements of animals between distinct areas which are not used at certain times of the year, used to happen or take place in many marine, fresh water and terrestrial taxa (Berger, 2004). Aggregate mammal migration which entails the seasonal and cyclic or oscilative movement of animals between certain distinct areas (Thirgood et al. 2004) is a unique phenomenon which attracts the attention of many, ranging from conservationists to tourists. Dingle & Drake (2007) observe that seasonal migration, where individuals make a return trip to and from physically separated home ranges to take advantage of variations in the biophysical conditions, is familiar among many taxonomic groups. Hebblewhite and Merrill (2007) note that the seasonal long distance movement is an adaptive response tactic that allows herbivores to avoid lack of food supply and perhaps diminish the risk of being fed on by predators. Harris et al (2009), who studied and mapped global aggregate migrations, have documented thus:
Twenty-four large mammal species (and subspecies) are known to migrate or to have migrated in aggregations-all ungulates. Mass migrations for 6 of these are extinct or their status unknown: springbok Antidorcas marsupialis, black wildebeest Connochaetes gnou, blesbok Damaliscus dorcas, kulan Equus hemionus, scimitar horned oryx Oryx dammah, quagga Equus quagga. Most migratory populations lack reports on their numbers, distances traveled, geographical routes, ecological drivers and threats. Where data exist, they are often over a decade old.
According to these authors, most of these aggregate migrantions have occurred or occur in Africa, where there are nine (9) enduring migrants occurring in six (6) areas namely Boma-Jonglei, Sudan; Mara-Serengeti ecosystem of Kenya and Tanzania; Tarangire in Tanzania; Liuwa between Zambia and Angola; Chobe and Kalihari in Botswana and; (Harris et al, 2009). Elsewhere in the world, there is also reported or documented six (6) combined wanerers left over for Eurasia, and four (4) for North America where the caribou or reindeer (Rangifer tarandus) occur in both.
Some of the known examples of long distance migrations and which are among the most stunning natural occurance or event include the long-distance recurrent movements of monarch butterflies Danaus plexippus in Northern American continent, the wildebeest Connochaetes taurinus in the Mara-Serengeti ecosystem, pallian birds athwart the Americas, and grey Eschrichtius robustus and humpback whales Megaptera novaeangliae in the Pacific Ocean (Wilcove, 2009).
Though the mapping of geographical locations of remnant aggregate migrants has been done, scientists' and conservationists' overall knowledge of migrations is still low (Berger 2004). Whereas a lot of research has been done on ecological drivers of aggregate migrations, more needs to be done on collective combined environmental and demographic changes affecting or which are likely to affect continuity/persistence of such migrations. Persistence of aggregate migrations is pertinent because of many reasons. For example, Frank (1998), McNaughton et al. (1988) & Caughley (1976), all cited in Harris et al. (2009) say that "mass migrants have positive feedback effects on grassland forage and indirect effects on ecosystem processes (e.g. increasing grassland production and raising nitrogen mineralization), and therefore losing migrations may result in ecosystem collapse". Mass migrations also boost economies of destinations through tourism. Truncation of such migrations will have a trickledown effect on other animal and plant species in the affected ecosystems. For example, if the wildebeest migration phenomenon never happened in the MSE, populations of other herbivores would without any doubt decline, the followed by the carnivore populations, and Serengeti-Mara would lose tourism business (Harris et al. 2009).
It is however noted that the phenomenon of long distance migration across many animal species and in many parts of the planet is being truncated and under threat from anthropocentric activities and developments leading to habitat destruction, barriers to movement, resource damage or depletion and climate change (Wikelski & Wilcove, 2008;and Dobson et al., 2010). As observed in the works of Bolger et al., (2008) and Harris et al., (2009), recurrent cyclic movement of animals was once a common phenomenon around the world, but this phenomenon has collapsed in many areas as a result of pressures from human activities and transformations in land-use and ownership. Berger (2004) observes that "many of the massive and historically described treks by herd-dwelling mammals have been lost from Asian steppes, North American grasslands and African savannas". Examples given include the bison of the North American Great Plains, where the population once comprised of as many as 30 million animals but nowadays only very few remnants exist, this being the result of unsustainable utilization (Bolger et al., 2008); similarly, the Saiga antelope of Central Asia, was also observed decline from well more than 1 million animals in the 1980s to under 200,000 animals by 2000 (Milner-Gulland et al., 2001); also the seasonal movement of large numbers of Thomson's gazelle and zebra between Kenya's Lakes Elmentaita & Nakuru and the Lake Baringo was witnessed truncate earlier in the 20th century due to uncontrolled utilization, habitat destruction, and other anthropogenic activities & developments (Ogutu et al., 2012). Harris et al., (2009) and Wilcove, (2009) further indicate that seasonal movement of animals is not well understood and much of it remain unknown and undocumented. This is proven by discovery of a migration event of large mammals in Sudan that is similar to that of the Serengeti in abundance, which stayed largely undocumented until 2007. It is of great value to understand migrations. A greater insight into the ecology of seasonal migration of wildlife is an important area in the planning of the management of functionally connected landscapes, in the conservation and management of species and for the protection and maintenance of threatened natural events or occurrences (Epps et al., 2011;Fynn & Bonyongo, 2011;Crooks & Sanjayan, 2006;Brower & Malcolm, 1991;Briers, 2002;).
Remnants of the migration phenomenon in the world today, particularly those that are transboundary, are threatened due to variations in the ways such resources are used and managed on either side of the boundary. There exists multiple phenomena associated with transboundary wildlife resources, management of which has proved challenging. This situation of shared resources and ecosystems has today called for territorial integrity as a principle to govern the relations between and/or among governments in order to avoid conflicts in resources utilization (Braack et al. 2006). Whereas much research work has been carried out on how, why and when animal migrations occur, not much effort has been directed towards establishing strategies towards retaining and sustaining remnants of such phenomena. The designing of successful strategies to ensure continuity or persistence such phenomena has also proved tricky as observed by Grooves et al. (2002), who note that planners face challenges because of variation in biological value and consequent use of landscapes.
In the Serengeti ecosystem for example, much effort has been directed at understanding how, when and why the wildebeest migrate. Majority of the longitudinal studies/surveys have used natural scientific experiment method in the field to study movement of collared animals using Global Positioning System (GPS) telemetry and aerial images. Other studies on the migration phenomenon need to be done. For this study, focus will be on the effect of the migration occurrence on sustainability of tourism development. The interrogation will be focused on how the variation of phenomenal elements or componets of wildebeest migration, namely the migration route, migrating population numbers, migration pattern & composition of migrating community will affect sustainability of tourism development. Migration route refers to the exact path or corridor followed by animals when on the move. Migration pattern is the calendar (season and timing) detailing where the animals are at a particular month of the year. Numbers refer to the population size while migrating community refer to the species composition of the animals. These features of the migration phenomenon may vary depending on human activities and changes in the environment. The variations will also have implications in the sustainability of tourism development in the MSE.
3. ii. Transboundary Resources in the East African Community
The East African Community is a regional block made up by six partners in the African Great Lakes region namely, Kenya, Rwanda, Burundi, Uganda, Tanzania and Southern Sudan. Cooperation among the member states is currently focused on customs union, common market, monetary union and political federation (Reith and Boltz, 2011).These states share many earthly and water ecosystems which are viewed as resources and a stock up of wealth for the economies of these countries. They include, but not limited to, wildlife (flora and fauna) and rich mineral reserves which if well put into use, could positively impact on the welfare of the community and alleviate poverty.
It is noted that the above mentioned shared ecosystems are facing major threats, including depletion of natural resources due to ever increasing anthropogenic pressure manifested in ballooning anthropocentric developments resulting in overutilization, untenable agricultural practices, overharvesting of fish, dumping of wastes affecting both on site and off site sources and sink capacities, uncontrolled reclamation and eventual damage of wetlands and ecosystems in and around sensitive places such as Lake Victoria and other set aside areas such as the MSE. If this is not addressed on time, these threats may result in momentous negative ecological, economic and social impacts.
Even though much is being done to appraise the policy, come up with legal and institutional frameworks aiming at the management of the natural resource base and the environment, those which touch the management of shared ecosystems and resources are inadequate and yet to be considered. The EAC Secretariat is struggling to harmonize the policies and institutional frameworks to address the management of natural resources lying astride the boundaries amid setbacks/hiccups of the ratification of the same in the individual member states. For example in Article 114, section 2 of EAC, Protocol for Environment and Natural Resource Management was signed by the Republics of Kenya, Uganda and United Republic of Tanzania on 3rd April 2006. The Protocol has since been ratified by the Republic of Uganda and the Republic of Kenya in 2010 and 2011 respectively. However, the United Republic of Tanzania is dragging her feet in ratifying the Protocol with reasons best known to them. The process to address their issues in order to finalize the ratification process and make the Protocol operational is still ongoing under the guidance of the Council of Ministers. The Republic of Rwanda, the Republic of Burundi, Southern Sudan and DRC Congo were not yet EAC Partner States at the time the Protocol was negotiated and signed. Furthermore, the Protocol is at present not in operation and hence not a lawfully binding document until it is ratified by all Partner States including new entrants.
4. b) Statement of the Problme
The wildebeest migration phenomenon at the Mara-Serengeti ecosystem (MSE) has been declared by UNESCO one of the new wonders of the world. This phenomenon itself together with other wildlife resources in the Mara and Serengeti ecosystem have led to development of tourism and growth of tourism business Year 2022 ( ) F in MSE area over the years. For the tourism development to thrive and be sustainable in the MSE, the ecosystem has to retain its self perpetuating status unaltered and its wildlife based tourism product has to persist, particularly the wildebeest migration phenomenon. In recent times the phenomenon has been, and continues to be used as a flagship marketing tool for the Masai Mara National Reserve & Serengeti National Park tourism & business. In the ideal situation, it is expected that the MSE will be sustained, the tourism development and growth will continue positively in terms of profitability & provision of jobs and livelihoods of the local people maintained as long as the spectacular nature of this migration phenomenon persists. However, the continuity of the ecosystem and persistence of this wildlife product (wildebeest migration phenomenon) has not been crossexamined. The Mara-Serengeti ecosystem experiences diverse and conflicting interests from different stakeholders surrounding the Mara and the Serengeti. This is compounded with different and conflicting resource use and conservation policies emanating from the fact that the ecosystem lies astride the border between Kenya and Tanzania. For example, resource use and conservation policies on the Tanzanian side allow settlement, cultivation & farming, hunting and harvesting of wildlife while on the Kenyan side tourism is allowed as the only acceptable use (Thirgood et al 2004). In brief, the Mara-Serengeti is a common property ecosystem shared between two governments and their respective surrounding communities. Due to conflicting interests and conflicting resource use policies, it has been described as, and is regarded as an ecosystem under siege (Mukeka, 2019& Waithaka, 2004). Its wildlife resources are likely to suffer a tragedy a result of wanton use and destruction minding only on gains without much care on the resulting negative environmental and socioeconomic impacts (Frischmann et al, 2019;Katerere et al, 2001). The ecosystem is facing enormous threats from a ballooning and burgeoning human population with higher poverty levels, conflicting land tenure systems on either side of the border, land subdivisions, fencing, fragmentation and destruction of habitats, changing of land use from livestock keeping (nomadic pastoralism) to crop farming, sedentarisation (settlement) and growth of market centers. All these anthropocentric processes are leading to blocking of wild game migratory corridors; range contraction, heightens poaching and general degradation of the environment (Ogutu et Furthermore, it has been observed that similar/related spectacular Long Distance Migration of animals elsewhere has been truncated due to similar anthropogenic issues beginning to impact the MSE. For instance, Wikelski & Wilcove (2008) and Dobson et al., (2010) ascertain that the phenomenon across many animal species and in many parts of the planet has been truncated or is under threat from anthropogenic pressures resulting in habitat destruction, causing barriers to movement, resource depletion and climate change. Bolger et al., (2008) and Harris et al., (2009) further observe that this phenomenon has collapsed in many areas because of transformations in land use and anthropocentric developments. Berger (2004) further observes that "many of the massive and historically described treks by herddwelling mammals have been lost from Asian steppes, North American grasslands and African savannas". As an examples given from the Great Plains of North America, the bison population was about 30 million animals but has since reduced to a dismal number due to unsustainable utilization (Bolger et al., 2008); from Central Asia, the saiga antelope once had a population of over one million animals in the 1980s, which has been observed decline to about 200,000 members by 2000 (Milner-Gulland et al., 2001); in Kenya, migration of large numbers of Thomson's gazelle and zebra between Lake Baringo and Lake Nakuru-Elementaita region was witnessed truncate in the early part of the 20th century, majorly caused by uncontrolled utilization, habitat destruction, and other disturbances from anthropogenic developments (Ogutu et al., 2012). Furthermore, Ogutu et al (2012) have observed that the Athi-Kapiti to Masai Mara wildebeest migration route has been lost, truncating the migration phenomenon. This has been due to habitat destruction & loss, and other human settlement and activities across the Narok & Kajiado landscape.
The migration phenomenon of the wildebeest at the MSE may eventually truncate completely given the goings on in and around the ecosystem. This will affect sustainability of the ecosystem, tourism businesses & development and livelihoods of the surrounding communities. Sustainability of tourism development and businesses dependent on this wildebeest migration phenomenon needs to be interrogated. For sustainable tourism development to be realized, continuity of migration should be ensured. It is therefore sensible to sieve through site-specific field information regarding the resource use and management practices and natural happenings that are likely to impact negatively on the migration phenomenon and by extension affect sustainability of the MSE. This will thereafter help in coming up with recommendations and strategies that are policy related towards retaining the phenomenon to ensure sustainable tourism development in the MSE.
5. c) Objectives of the Study i. Overall Objective
The overall objective of the study was to assess the role of the in the Maasai Mara & Serengeti ecosystem from wildebeest migration pattern on sustainability of tourism development a transboundary perspective.
6. II. Literature Review a) Theoretical Review i. Theories Guiding the Study ii. Rational Choice Theory
This is a theory also known sometimes as Choice Theory or Decision Theory. According to Blume & Easley (2007), it is also sometimes referred to as Rational Action Theory (RAT). Although its origin may be a bit murky, Oppenheimer (2008) observe that modern roots of Rational Choice Theory (RCT) stem from the socalled 'age of reason' in the 1650s when Thomas Hobbes Leviathan tried to explain the essential operation of political institutions by means of individuals' choices.
Hobbes formed an opinion that choices are anchored on universally held 'appetites' and 'aversions'. In a layman's language, choices over given options/alternatives will be based on desires/wishes for or oppositions to those given alternatives. This kind of argument was later continued in the 1770s by famous persons such as Francis Hutcheson, David Hume, Adam Smith, and later on by Utilitarians as Jeremy Bentham and John Stuart Mill in the 1800s. This was further supported by many others who followed in the 1900s, including many in economics e.g. Robbins in 1938(Oppenheir, 2008). These works spawned what has come to be thought of as classical or conventional rational choice theory.
The classical RCT rides on three premises: peoples' favorite judgements are made in pair-wise comparisons; all choices from which one pick or decide are comparable; allows two pair-wise associations to be inherited by a third pair in the following manner: if the relation is transitive then if x relates to y, and y relates to z, then x relates to z (Blume & Easley, 2007). The RCT has formed a construction for comprehending and quite often modeling social and economic behavior. The essential hypothesis of rational choice theory is that collective social behavior is a consequence of the behavior of entity actors/participants, each of whom is making their personal choices. The RCT therefore concentrates on the influencers of the personal choices sometimes referred to as methodological individualism.
In summary, RCT rides on the assumption that an actor has favorites among the available options or alternatives allowing each of the players to pick on preferred choice. The second assumption in the RCT is that the preferences are complete in themselves i.e. the individual can constantly say which of the available alternatives they consider favorable or that neither is chosen or favored to the other. The third & last assumption is that the two alternatives can relate to a third option i.e. transitive (if choice x is preferred over choice y and choice y is preferred over choice z, then x is preferred over z). In this case, according to Blume & Easley (2007) &Mortazavi, S. ( 2004), "the rational agent is assumed to take account of available information, probabilities of events, and potential costs and benefits in determining preferences, and to act consistently in choosing the self-determined best choice of action".
In reference to the MSE, among the many choices which stakeholders have on the table include choosing to: conserve biodiversity (wildlife); sustain tourism development/experiences; sustain private companies businesses; sustain local people's livelihood. Depending on the category of the stakeholders, the rational agent will choose from among these alternatives according to the perceived benefits and/or costs expected to accrue from their choices.
7. b) Empirical Review
8. i. Migratory Pattern (Season and Timing)
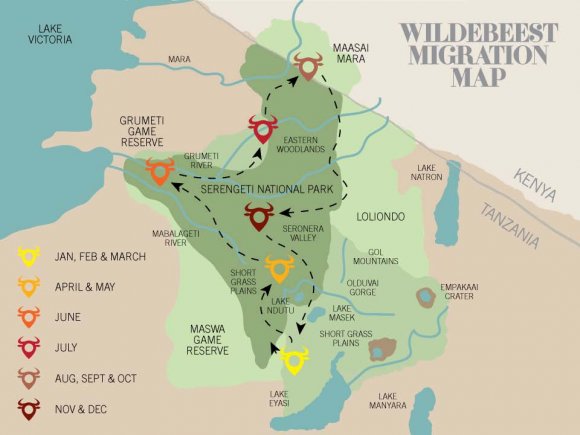
The wildebeest migration (& the accompanying community) in the MSE is regulated by availability of water/rain and vegetable food (green grass). From a study carried out in 2004 titled "Can parks protect migratory ungulates? The case of the Serengeti wildebeest" by researchers, the common pattern of motion indicates that the animals are located or sighted in the southern Serengeti National Park and Ngorongoro Conservation Area in the months of March and April. They then move westwards and then north into the western region in the months of May & June. From here, they continue moving north through Grumeti Game Reserve, Ikoma Open Area and Ikorongo Game Reserve during June and July. The migrating community reaches the south of Maasai Mara National Reserve and Northern Serengeti National Park during July and August. Most of the wildebeest remain in or close to the MMNR throughout August and September prior to going back to the south in October and November and finally concentrating in the Southern Serengeti & Ngorongoro Conservation Area in the wet season spanning December to April (Thirgood 2004). A summary of the movement is illustrated in figure 2 in appendix 1.
As can be seen in the account above, the great migration lasts a whole calendar year. From other observations elsewhere, tourism and hospitality facilities development has also traced and relied on the pattern of movement of the wildebeest. For example:
Serian's Serengeti South Camp, Serengeti, Tanzania: is operated between the months of December and April down south in the Ngorongoro conservation area where visitors are treated to a spectacle in Serengeti South plains experiencing the peak of the wildebeest calving season.
In the months of April & May, when the rains have hit back across the plains pouring millions of gallons of water on to the rich fertile soil. The landscape is transformed into green carpet of grass and other plants. The Seronera area soon becomes a moving mass of millions of migrating animals, the Moru Kopjies are a hot viewing spot, and as the season moves along on the western corridor, Grumet plays host to the herds.
June to July: this becomes the Singita Sasakwa Lodge opportunity to reap from the experience. Located in the privately run Grumeti reserve, it enjoys the advantage of being along the migration path giving the visitors a vantage position to view the migrating community surge on
The above examples of facilities could be just but a few of the many businesses and developments put in place or done to facilitate tourism activities geared towards experiencing the great migration among other attractions in the MSE.
Apart from determining the spread and situating of businesses across the MSE landscape, the pattern of movement sees the wildebeests and other members of the migrating community reach different parts of the MSE at different times of the year in their cyclic movement. This helps in ensuring environmental sustainability in a number of ways. The first one is nutrient cycling in the system. In their study entitled 'Collapse of the World's Largest Herbivores' (body mass ?100kg), Ripple et al (2015) detailed the role and effects of herbivores, such as the Serengeti wildebeest, on ecosystems. One of the roles the observed is nutrient cycling. The grazing and defecations across the landscape helps in the redistribution of nutrients. The migrating ungulate community in the Mara and Serengeti ecosystem consumes huge amount of plant and grass vegetable biomass per unit area. In so doing, they affect nutrient cycles through mechanisms which have both direct and indirect consequences in the functioning of an ecosystem. The ungulates (the wildebeests, the Zebras and Gazelles) greatly accelerate the recycling of nutrients in the Serengeti and the Mara through the consumption and resultant defecation and urination, thereby returning to the soil the consumed nutrients at more faster rates than would be through the natural longer process of leaf loss and grass drying and later decaying, releasing the nutrients slowly (Ripple et al, 2015;Doughty et al, 2013). Also, through the consumption by the animals, the consumed nutrients are excreted in urine and feces creating patches of concentrated nutrients that can last for several years in the ecosystem, releasing the nutrients slowly for use or storing them for future use by other plant or vegetation communities (Doughty et
9. c) Conceptual Framework
A field study would establish a relationship between the thematic areas of the migration pattern and sustainable tourism development. Conceptually, a proposed framework to study this relationship could be as shown here below:
10. III. Research Methodology a) Research Design
This study the study adopted a mixed method approach where both quantitative and qualitative techniques were utilized to collect information from respondents. Simply put, the study was executed by means of a mixed methods approach. As argued by Creswell (2012Creswell ( & 2009)), research problems are better understood when both quantitative and qualitative techniques are used in combination, giving an opportunity for gaining more insight than when one approach is used alone or by itself. Adopting a mixed methods approach in research allows the researcher to be somewhere in between the range or continuum of qualitative and quantitative techniques, an approach which began following a contention that using both qualitative and quantitative data "provides a stronger understanding of the problem or question than either by itself" (Creswell, (Creswell, 2013 p.215).
Mixed methods research as a design brings into combination all the truth-seeking or theoretical assumptions with techniques guiding the gathering and analyzing of data, carefully drawing from the qualitative & quantitative mix in the many stages of the research process. As a research technique, mixed methods approach concentrates on gathering and analyzing both qualitative and quantitative data in one study or sometimes in more or a series of studies done continuously, itscentral foundation being seeking to better comprehend a research problem than when one approach is used alone (Elliot, 2005). (Elliot, 2005).
The target population for the study consists of government conservation agencies employees of the MSE, non-governmental conservation organizations employees, hospitality facilities owners/managers, tourism business owners, tourists and local community members.
A part of a sample population which ha been procedurally selected in order to represent that population in a study is referred to as a sample size (Oso and Onen, 2008). This procedural selection of a part of the entire population is called sampling in which a few items are picked from a particular group aiming at obtaining relevant data which can be used in drawing conclusions about the entire group (Dwivedi, 2006). The sample size in a study is determined by the goals of the researcher i.e. the purpose of the study, what the researcher is seeking to know, credibility and viability of the study depending on the available time, space & resources, what is at stake and what will be of importance (Patton, 2002). Sample size should be determined carefully to ensure that it is manageable within the available resources in terms of time and finances (Kothari, 2008).
This study adopted Nassiuma's (2000) Coefficient of Variation in determining strata sample size in which it is assumed that in most surveys, "a coefficient of variation in the range of 21% and a standard error in the range usually acceptable". Guided by Nasssiuma's assertion, this study use a coefficient of variation of 30% and a standard error of 2% which were selected to ensure low variability in the sample and to minimize the degree of error respectively. Nassiuma's (2000) formula is presented as below:
n = NC 2 C 2 + (N-1) e 2Stratified random sampling technique was used to increase precision and presentation (Kothari, 2004). From a target population of 14983, a sample of 221 respondents was selected for this study, i.e. n=221. Proportionate sampling was used to determine the number of respondents from each stratum as shown in the last column in the table above. In each stratum, simple random sampling was used to ensure that each individual had an equal chance of being included in the sample. Purposeful/convenience sampling was also used to select respondents from strata where exact total population could not be ascertained to purposively participate in this study.
The implementation of, and following of generally acceptable protocols and procedures marks the beginning of managing and controlling for nonresponse error in a study, for example comparing respondents to non-repondents in a small random sample [such as in a pilot survey], using appropriate protocols and procedures to maximize participation in the study to enable the researcher obtain "a high enough response rate to conclude that non-response rate is not a threat to external validity or obtain a response rate that warrants additional procedures for ensuring that non-response is not a threat to external validity" (Murphy et al. 2001). Furthermore Lunstrom and Sarndal (2001) observe that non-response can be catered for by straight expansion of the sample within each stratum using the inverse of the stratum response fraction with the assumption that every element within a given stratum in the sample frame responds with the same probability.
To cater for non-response, the sample size was adjusted upwards using response rate from the pilot study. In this case it can be said that the pilot study was used to serve two purposes; one, to iron out the data collection tool (the questionnaire) and two, to determine the questionnaire return rate. In the pilot survey, 23 questionnaires were used (10% of the minimum sample i.e. n=221) out of which 15 were completed and returned (65.2% response rate). All of the returned questionnaires from the pilot study had no item nonresponse meaning they were valid. This means that in this study, if all 221 questionnaires are distributed and all of them returned, the response rate is 65.2%. in the real study, the sample was therefore adjusted upwards to 339 (100% response rate if all the 339 distributed questionnaires are returned). With the foregoing, the adjusted sample used in the study is as given in table 1 below: This study utilized a structured questionnaire and an interview schedule for individual and focus group discussions. The questionnaire items were built on a five-point Likert scale (Amin, 2005; Boone & Boone, 2012; Sisson & Stocker, 1989), the questions gave the respondents opportunities to make a definite choice expressing the direction and strength of each statement, and for them not to give answers that are socially pleasant instead of providing the reality of the issue being investigated on (Nowlis, Kahn & Dhar, 2002).
Y = ? + ? 1 X 1 + + ? X = the independent variables - X 1 -migrating pattern (season & timing) IV. Discussion of Findings a) Response RateOut of 339 questionnaires distributed in the field, 248 were completed and returned. 91 questionnaires were not returned. The response rate in this case was 73.2% indicating that respondents were willing to take part in the study and which is good enough for this study. The response rate results are tabulated below:
Quantitative data was analyzed using descriptive and correlation statistics which include frequencies, percentages and means. The multiple Regression analysis technique was used to determine the relationship between the independent variables (migration pattern features) and the dependent variable (sustainable tourism development), and is also used to test hypotheses of the study. The regression model used for this purpose is as given below:
Where:
Y= the dependent variable (Sustainable Tourism Development)
11. b) Screening and Preparation i. Analysis of Data Entry Errors
Upon receipt of the filled questionnaires, screening was done to identify invalid questionnaires. Two types of invalid questionnaires were identified; incomplete questionnaires where some items were skipped (item nonresponse) and double marking on one item. These questionnaires were identified as invalid and expunged from the field data. In total 16 questionnaires were invalid. This left 232 questionnaires (with a response rate of 68.4%) to be valid and these are the ones which were used for the study.
12. c) Descriptive Statistics for the Various Variables Under Investigation i. Migration Pattern on Sustainable Tourism Development in the Mara-Serengeti ecosystem
The second specific objective was to assess the effect of Migration Pattern on sustainable tourism development in the Mara-Serengeti ecosystem. Migration pattern deals with season and timing of movement of the wildebeests. Much of this looks at the migration calendar throughout the migration cycle. The migration cycle lasts a full calendar year starting in January at South Serengeti and ending in the close of December when the animals return to South Serengeti again, starting the cycle all over again in January of the following year. In this study, it was assumed that tourism development in the MSE would be sustainable if the migration pattern of the migrating wildebeests would remain unchanged or persist in its original, favorable and ideal state without experiencing any variations in any of its aspects such as the timing of movement and location of the animals across the Mara-Serengeti landscape. As one of the features of the wildebeest migration phenomenon, the research sought to find out if Wildebeest Migration pattern is experiencing any variations and thus affecting sustainable tourism development in the MSE region. As with the previous feature, a number of given statements were assessed and ranked on a five-point Likert Scale by respondents to indicate characteristics of, and the extent to which the migration pattern, as one of the migration phenomenon features, has varied or changed over time. From the research, as to whether the migration starts earlier or late/delays than before, respondents were not sure of what happens. This is indicated by results thus; (mean 3.24, SD 1.352) and (mean 3.33, SD 1.328) respectively. This was also the same case with the migration cycle where respondents were to indicate whether the migration cycle (migration calendar) has been shortened or extended. The results are (mean 3.16, SD 1.034) and (mean 2.96, SD 1.058) respectively. Most importantly, the research found out that of late the migration pattern (season & timing) and migration cycle fluctuates from time to time (mean 3.92, SD 1.223) and (mean 3.81, SD 1.288) respectively. These results of fluctuation were corroborated with the disagreement by respondents to the statement that 'migration season and timing have remained unchanged over the years' (mean 2.47, SD 1.322).
Two sets of cause could be blamed for the variations in the migration pattern aspects. They include natural occurrences in the MSE as indicated by responses from the field (mean 3.72, SD 1.075) and human activities & interferences in and around the MSE (mean 4.03, SD 2.211). Natural occurrences could be as a result of climate change which has led to erratic weather conditions in the region. The cycle is controlled by rains and availability of fresh grass growths in the larger MSE, and by instincts in the migratory wildebeests which trigger movement depending on where it is raining and thus availability of water and food. With erratic weather conditions due to climate change, the migration pattern is disrupted and altered (Dore, 2005;Fyumagwa et al. 2013;Walling, 2007).
The human factor in alteration of the migration pattern comes from the anthropogenic pressures in the MSE resulting from human activities (both those allowed and those illegal) and other interferences in the ecosystem (Homewood et al, 2001;Woien & Lama, 1999). As it has been mentioned above, among the human activities interfering with the migration pattern is such as the use of prescribed fires in the managing of the savanna grassland vegetation (the grasses), a case where dry grasses are set on fire to give way to new fresh grass growth for livestock and also to control pests such as ticks. The prescribed fires are also used in the protected areas by government conservation agencies to trigger growth of young fresh grass for wildlife. The unfortunate eventuality is the fires ending up with an unintended result of repulsing or obstructing the movement of the wildebeest and other animals in the migrating community. Another human activity which has led to variations in the migration pattern feature is the fencing off of private land. This is governed by the land tenure system in place as earlier indicated above. It has already been indicated that on the Kenyan side of the MSE, there is provision for private ownership of land which is different from the Tanzanian side of the border where land is owned by government and Ujamaa Villages. On the Kenyan side, some land owners have preferred setting aside pasture for their livestock as opposed to sharing their grounds with wild animals although there exists many conservation initiatives but not many locals have access to these and benefits from such initiatives vary (Homewood et al, 2001). Some farmers have fenced their parcels obstructing wildebeest migratory routes hampering animals' movement. This has most of the time given way to or resulted in wildlife-human conflict. In the Mara on the Kenyan side of the MSE, some of the traditional wildebeest maternity grounds such as the Loita plains have been taken and fenced off by private land owners (refer to Figure 5 above of a picture taken by the researcher while in the field for data collection). It is these disturbances of obstructing wildebeest paths through fencing which have repulsed the animals, by making them to arrive late and depart earlier. It has also been observed that some farmers intentionally use prescribed fires to block movement of wildebeest. Prescribed fires have traditionally and culturally been used to manage land use practices in the Serengeti and Mara. The intended use has been burning away old dry grass to give way for regeneration of short green grass for both wild game (wildebeest and other herbivores) and for the livestock of local farmers. While this has been the practice, in contemporary times, the intentions have shifted either to blocking of wild animals from surging forward or with the intention of delaying their migration. This is either meant to make them stay longer at a given place to achieve a prolonged experience for tourists or push the animals back, scaring them from crossing over to either side of the boundary. The end result in some areas has been range contraction due to repulsion of wildebeest (Ogutu et al, 2011) or discouraging migration making some of the ungulates become residents on either side of the border. The change in fire regimes will continue to amplify interactions between anthropogenic drivers and end up creating a situation where we have difficulty in deciding trade-offs between environmental and social & economic objectives. More research needs to be done aiming at strategic collection of data on the impact of prescribed fires on migratory animals and thereof resultant impacts on socioeconomic variables characteristic of tourism development in the Mara and Serengeti ecosystem (Kelly et al, 2020).
On the Kenyan side of the border where tourism & wildlife conservation have been embraced, some of the land owners have pooled their parcels of land together to form conservancies to participate in wildlife based tourism activities with the aim of generating extra income from tourism. These conservancies are extensions of conservation areas and free movement areas for wild herbivores and even carnivores which prey on the ungulates. Among The development of physical features along and across the wildebeest migratory corridors has also contributed to variations in the migration pattern of wildebeest. The developments are such as construction of roads to enable movement and traversing across the MSE landscape by both locals and tourists. Some proposed road projects are yet to be implemented (Fyumagwa, 2013;Dobson, 2010). When wildebeests reach such obstructions or barriers, they turn back cutting their journey short. Refer for example to the work of Holdo et al (2011) on predicted impact of barriers to migration on the Serengeti wildebeest. The construction of hospitality facilities across the MSE landscape and putting up of fences around them, is also a development which ends up obstructing and distracting forward movement of the migrating wildebeest and other members of the migrating community (refer to the Mara River Camp causing obstruction to crossing and movement of wildebeest in the migration route section above and appendix 9 in the appendices section). Hospitality facilities are built closer to migratory routes so as to give visitors the best opportunity to view and witness the migration spectacle at a closer range but ends up causing variations to the migration pattern. To this end it can be concluded that the strongest factor causing variation in the wildebeest migration pattern is the biotic human factor, (mean 4.03, SD 2.211), coming in form of development activities by farmers and tourism business owners and interferences such as the lighting of prescribed fires across the MSE landscape.
To crosscheck on the results in the four objectives above, the researcher sought to find out the extent of dependence of the three attributes of the dependent variable (sustainable tourism development) on the migration phenomenon. The three attributes considered in this study included tourism business, livelihoods of the local people and environmental/ecosystem sustainability. In this case, it was also assumed that tourism development in the MSE would be sustainable if the tourism businesses, people's livelihoods would continue thriving & the ecosystem would remain or persist in its original, favorable and ideal state, without experiencing any variations due to alterations in the migration phenomenon. The research therefore sought to find out if there is any influence of the migration phenomenon on the above mentioned attributes of sustainable development. As in the case of the five objectives above, a number of statements were assessed and ranked on a five-point Likert Scale by respondents to indicate characteristics of, and the extent to which the migration phenomenon influence the said three attributes of sustainable development in the Mara and Serengeti ecosystem.
13. iii. Tourism Business
Regarding tourism businesses in the MSE, the research sought to know if choice of location and performance have depended or been influenced by the migration phenomenon. Further, the research sought to know if variations in the migration phenomenon have affected businesses in any way. The table below gives a summary of the findings: The research results indicate that all the four features of the migration phenomenon considered in the study influence location of tourism business. Of the four features, migration route is the best indicator in influencing the choice and location of business (mean 4.08, SD 1.214). Tourism business facilities such as hospitality facilities (hotels, lodges, tented camps and camp sites etc.) are built or set closer to migratory routes so as to give visitors the best opportunity to view and witness the migration spectacle at a closer range. Migration pattern come in as the second best indicator of choice and location of tourism business (mean 4.00, SD 1.087). Migration pattern is controlled by the sliding gradient of availability of resources (fresh vegetationgrasses & rain-water) for the migrating animals. Migrating numbers and migrating community composition come at the bottom after the above two in their influence on the choice of location of business (mean 3.81, SD 1.334 and mean 3.82, SD 1.113) respectively. The sighting of a million animals at a go and the variety of species involved, together with ambushes from carnivores is more pleasing and attractive to tourists. If such characteristics of the phenomenon deteriorate, the experience also deteriorates and thus becomes less spectacular and less attractive to the visitors. The research also strived to find out if business performance is influenced in any way by, or depends on the migration phenomenon. It was found that business performance depends more and more on the migration phenomenon (mean 3.85, SD 1.157). This outcome is corroborated with the negation to the statement that 'tourism business performance has depended less on the migration phenomenon' (mean 2.38, SD 1.106). Further to the foregoing findings, it is confirmed that there has been observed a decline in performance of tourism business due to deterioration of the migration phenomenon over time (mean 3.64, SD 1.064). This finding is also corroborated with the
14. Migration route influenced choice of location of business Migration pattern influenced choice of location of business Migrating numbers sighted influenced choice of location of business Migrating community composition influenced choice of location of business Choice of location of business was never influenced by any of the features of the migration phenomenon
Business performance has depended more on the migration phenomenon Business performance has depended less on the migration phenomenon Deterioration on the migration phenomenon has led to decline in performance of business Businesses have downsized due to changes in the migration phenomenon Changes in the migration phenomenon have no significant changes in business perfomance Valid N (listwise)
ii. Sustainable Tourism Development negation to the statement that 'changes in the migration phenomenon have no significant changes in business performance (mean 2.03, SD 1.279). These findings put together with the findings indicating variations/alterations of the individual features of the migration phenomenon would point to a situation where tourism business development is not sustainable.
15. iv. Livelihoods of the Local People
Regarding livelihoods of the local people in and around the MSE, the research sought to know if they have depended, been influenced or affected by the migration phenomenon. Further, the research sought to know if variations in the migration phenomenon have affected livelihood opportunities in any way. The table below gives a summary of the findings: The research results indicate that all the four features of the migration phenomenon considered in the study influence local people's livelihoods. Of the four features, migrating community composition is the best indicator in influencing the said livelihoods. Research found out that migrating community composition has been, and continues to be economically beneficial to locals (mean 3.94, SD 1.170). This is more so to those operating businesses and those employed in the various facilities in and around the MSE. Tourism business facilities such as hospitality facilities (hotels, lodges, tented camps and camp sites etc.) are built or set closer to migratory corridors where we would have large concentrations of the migrating animals. This is meant to give visitors the best opportunity to view and witness the migration spectacle at a closer range. With persistent and more spectacular herds, the experience is more pleasing, attracting more visitors consistently. This means more business and ensured job opportunities. Migration pattern come in as the second best feature in influencing the livelihoods of the local people (mean 3.92, SD 1.160). Migration pattern is controlled by the sliding gradient of availability of resources (fresh vegetation-grasses & rain-water) for the migrating animals. Migration pattern looks at the season and timing of the arrival and departure of the migrating herds. This also helps in determining the high/ peak season and low season of business and accompanying benefits to the local people. Migrating numbers and migration route come at the bottom after the above two in their influence on the livelihoods of the local people. The results indicate that the migrating population numbers and the migratory route also have been, and continue to be of benefit to the local people (mean 3.79, SD 1.229 and mean 3.66, SD 1.444) respectively.
Further results from the research indicate that local people have benefited more from the migration phenomenon (mean 3.69, SD 1.202) as opposed to its disadvantages (mean 2.70, SD 1.126). Among the benefits which come with the phenomenon include the business opportunities from tourism and the buffering of livestock from carnivores where carnivores will prefer preying on the wildebeests to local people's livestock. The disadvantages include competition for resources (water, pastures & space) and spread of diseases from wildlife to locals' livestock. Perhaps the most important finding in the livelihoods attribute is the finding that there is relationship between the migration phenomenon and the livelihoods of the locals. This is confirmed by the negation to the statement that 'there is no relationship between the phenomenon and the local people's livelihoods' (mean 1.99, SD 1.252). While business opportunities grew over time, thanks to the wildebeest migration phenomenon (mean 3.59, SD 1.078), the growth has not been sustained as there has also occurred a change to this growth. This has been indicated by the negation to the statement that 'locals' business opportunities have remained unchanged over time (mean 2.25, SD 1.027). Though, a study needs to be done specifically to establish the kind of change to business opportunities because respondents were not sure if there has been a decline in the said opportunities (mean 2.72, SD 1.017).
16. v. Environmental Sustainability
Lastly, the research sought to establish if the migration phenomenon plays any role in influencing environmental sustainability in the larger MSE. All the four features of the migration phenomenon i.e. migration route, migration pattern, migration population numbers and migrating community composition together with the control variable (resource use & management practices) were considered. Respondents were asked to assess and rank given statements regarding the phenomenon and environmental sustainability. Results are tabulated below: Resource use & management practices (the Control Variable) stood out to be the best indicator among environmental sustainability influencers (mean 3.83, SD 1.179). These include the uses & management practices which lead to variations in the features of the migration phenomenon. Resource use policies such as land tenure policies and wildlife resource use policies, on either ends of the wet ranges define how resources are used and managed. The using of prescribed fires during the dry season in and around protected areas, the fencing of privately owned land and around facilities along and across migratory corridors, direct harvesting of animals etc. disrupt the movement and numbers of the affected species across the MSE landscape. Another important feature of the migration which influences environmental sustainability is the migration pattern (mean 3.75, SD 1.138). As mentioned earlier in this research work, and relying on the findings from the research work of Ripple et al (2015), the pattern of movement sees the wildebeests and other members of the migrating community reach different parts of the MSE at different times of the year in their cyclic movement. It was observed that this helps in ensuring environmental sustainability in at least two ways. The first one is that of bringing about nutrient cycling in the system. The grazing and defecations across the landscape helps in the redistribution of nutrients. The migrating ungulate community in the Mara and Serengeti ecosystem consumes huge amount of plant and grass vegetable biomass per unit area. In so doing, they affect nutrient cycles through mechanisms which have both direct and indirect consequences in the functioning of an ecosystem. The ungulates (the wildebeests, the Zebras and Gazelles) greatly accelerate the recycling of nutrients in the Serengeti and the Mara through the consumption and resultant defecation and urination, thereby returning to the soil the consumed nutrients at more faster rates than would be through the natural longer process of leaf loss and grass drying and later decaying, releasing the nutrients slowly (Ripple et al, 2015;Doughty et al, 2013). Also, through the consumption by the animals, the consumed nutrients are excreted in urine and feces creating patches of concentrated nutrients that can last for several years in the ecosystem, releasing the nutrients slowly for use or storing them for future use by other plant or vegetation communities (Doughty et al, 2013;Danell et al, 2006). Thousands of the animals die at river crossings, part of the flesh is fed on by crocodiles, and the rest of the carcasses rot away releasing Carbon, Nitrogen, Phosphorous and other nutrients into the aquatic system. The nutrients are finally passed on to the terrestrial system and process repeats itself (subalusky et al, 2017). The second way of ensuring environmental sustainability is the removal of millions of tones of biomass from the physical environment though feeding on vegetation (grasses & leaves from shrubs). Being among the large wild herbivores, the migratory Serengeti and Mara wildebeest together with the accompanying migrating community of Zebras and Gazelles play a crucial role in the sustenance of the Serengeti -Mara ecosystem and the surrounding local communities (Ripple et al, 2015). As noted earlier in this research work, they form (Connochaetes taurinus, migratory Zebra and Gazelle) a very vital transboundary resource in the Mara and Serengeti ecosystem, whose alteration or loss definitely have cascading catastrophic effects on other biotic & abiotic aspects of the Serengeti and the Mara, including far reaching negative impacts on large carnivores which prey on the wildebeest, and on ecological processes involving vegetation (the savanna grasses on which the wildebeests feed), Savanna grassland fire regimes (Subalusky et al, 2017;Ripple et al, 2015). In their feeding on grasses across the savanna of the MSE thereby helping in the removal of plant or vegetation biomass through increased grazing pressure, the sheer population numbers of the wildebeests and other migratory ungulates (migratory zebra and gazelles) of the ecosystem regulates the spatial distribution of fires across the landscape and also shapes the frequency & intensity of the fires (Kelly et al, 2020;Ripple et al, 2015). If the foregoing is anything to go by i.e. if the wildebeest population and those of the other migratory ungulates are altered, it may lead to a future of an ecosystem that will be deficient in or lack vital ecological services which these ungulates provide, whose end result will be enormous ecological, economic and social costs (Ripple et al, 2015).
This vegetation would otherwise dry up and help fuel up and intensify grass land fires during dry spells which escalate destruction & loss of habitat.
The contribution to environmental sustainability by migration pattern is compounded by the sheer numbers involved in the migration as found out by the study (3.63, SD 1.170). Apart from nutrient cycling, the ungulates also serve as food to thousands of carnivores in various parts of the MSE. The migratory route comes at the bottom in contributing to environmental sustainability. Respondents were almost neutral as to whether migration route is important (3.43, SD 1.375). From the foregoing results, one would conclude that all the features of the migration phenomenon are essential in ensuring a complete self-perpetuating system in the MSE. If the migration phenomenon is altered, the ecosystem is also disrupted.
17. d) Correlations Analysis
The study made use inferential statistics in trying to establish the relationship between the migration pattern and sustainable tourism development in the MSE. Each of the features of the migration pattern was assessed/run separately against sustainable development to establish the relationship. The results are presented in the tables below:
As for the migration pattern, the Pearson Correlation results in the table below show a weak but positive relationship between it and tourism development sustainability. This means that when the migration pattern status is at or restored to its most favorable and ideal state, it contributes up to 39% to tourism development sustainability. Equally, if the migration pattern is varied to unfavorable state (truncated or interrupted negatively), it affects tourism development sustainability negatively up to 39%. Similarly, as is with the case of migration route, the wildebeest migration pattern is also facing threats from both anthropogenic pressures (in form of human activities) in the name of development (Fyumagwa, 2013) and enhancing livelihoods (Mfunda, 2010;Fyumagwa et al. 2013), coupled with natural processes of climate change (Dore, 2005;Fyumagwa et al. 2013) and vegetation succession processes facilitated with soil breaking by hoofs of ungulates. These disruptions across the MSE landscape due to land-use changes and many other human activities may probably result in range contraction Ogutu et al. (2011). Pearson Correlation results for the migrating population numbers indicate that this feature of the wildebeest migration phenomenon also influences tourism development sustainability to some extent.
There is also a weak but positive relationship between migrating population numbers and sustainable tourism development. If its status is varied negatively from its original ideal and favorable state, it will negatively affect sustainability up to 31% as seen in the results. Similarly, if the status of this feature remains or is restored to its most ideal and favorable state, it will contribute positively to tourism development sustainability up to 31%. 4 The calculated F-value is 42.928 while the critical F-value at degrees of freedom (1, 230) and at 0.05 significance level is 3.882. This also gives a higher calculated F-value than the critical F-Value, therefore falling in the rejection region of the F distribution graph. This implies that there is a statistically significant relationship between the migration pattern (season & timing) and sustainable tourism development in the MSE. Therefore for this given reason also, the null hypothesis that there is no statistically significant relationship between migration pattern or migration cycle and sustainable tourism development in the Mara-Serengeti ecosystem is rejected. The rejection of the null hypothesis is further confirmed by the P value of .000 in the coefficients table below.
18. f) Focus Groups Discussion Results
In the focus groups discussions, the researcher sought to capture sentiments and/or feelings & opinions of respondents on, and about the relationship between the wildebeest migration phenomenon and: (i) sustainability of the Mara -Serengeti ecosystem i.e. the biotic and abiotic systems which make up the natural physical environment; (ii) sustainability of the tourism and hospitality businesses within and around the Mara-Serengeti ecosystem; and (iii) sustainability of the sociocultural and economic livelihoods of the local people living around the Mara-Serengeti ecosystem. In the group discussions, focus was on the four main thematic areas of the wildebeest migration phenomenon which include: (1) the wildebeest migration route; (2) the wildebeest migration pattern -season and timinglooking at arrival and departure of the migrating community at different points along the migration route;
(3) the migrating population -the size or numbers of moving or surging animals; and (4) the composition of the migrating community -wildebeests, zebras and gazelles.
In addition to the aforementioned areas of focus, the researcher also sought to capture feelings and sentiments or opinions of respondents in the engaged groups on and about how resource use and management practices & activities of communities living around the Mara-Serengeti ecosystem, the conservation agencies and the business owners affect the migration phenomenon and how, by extension, they affect sustainable tourism development at the MSE. In other words, the researcher sought to find out how the above mentioned communities resource use and management practices and activities affect the wildebeest migration route, wildebeest migration pattern (arrival and departure season & timing), wildebeest migration population (size or numbers) and the composition of the migrating community (wildebeest and the accompanying animals such as zebras and gazelles).
19. Model
Sum of Squares df Mean Square F Sig. As mentioned above, focus group discussions were conducted to get opinions, sentiments and feelings of respondents on the variables under study. To this end, and according to Green (2012), focused groups generally consisted of small groups which were constituted to discuss a specific topic on sustainability of tourism development in the MSE. The idea here was to get the collective views about the wildebeest migration phenomenon and its influence on sustainable tourism development in the Mara & Serengeti ecosystem. This was assumed could help to bring out the truth as individuals engaged each other in the discussions and any individual member of the group trying to lie or give a contrary opinion could be disapproved by the others. As observed by Gill (2008) focused group discussions were used in the study to help generate information on collective views regarding the salient features of the wildebeest migration phenomenon and the meanings that lie behind those views in matters sustainable tourism development in the MSE. The discussions in study were guided by an interview schedule designed by the researcher using carefully asked open ended questions to bring out the desired thematic information. Focused Group Discussions (FGDs) in this study, according to Stewart and Shamdasani (1990), were to help the researcher understand nuances of feelings, attitudes, beliefs, opinions and mainly get in-depth thematic information that can be used to back and supplement what the other data collection instruments (in this case the structured questionnaire) gathered. FGDs were also used because the researcher in certain instances had to engage a big audience in which case interacting with each individual could not be cost effective and necessary e.g. the Ololai Mutia market and the Sekenani Gate market situations. In this study the researcher guided the groups specifically to bring out the themes useful to the study. Interviewing and recording was used to capture statements, supplemented by tape recording when necessary particularly where there was time limitation.
In the focus group interviews, five groups in total were engaged. They included: (1) Participants in the focus group discussions were also asked to explain how (if at all they understood) their resource use, management practices and activities affect the migration phenomenon features and how the uses, management practices and activities affect or may affect sustainable tourism development in the Mara & Serengeti ecosystem. During these focus group discussions, five resource use, management practices and activities by locals and conservation agencies were identified. The results are presented in the table below: The study sought to assess the effect of the wildebeest migration pattern on sustainable tourism development in the Mara-Serengeti ecosystem. The assumption against this feature was that there is no statistically significant relationship between migration pattern and sustainable tourism development in the Mara-Serengeti ecosystem. From results realized, the study concluded that there is a statistically and significant positive relationship between migration pattern and tourism development sustainability in the MSE. The null hypothesis was rejected as well.
ii
20. . Migrating Population Numbers and Sustainable Tourism Development
The third objective sought to assess the effect of migrating population numbers on sustainable tourism development in the Mara-Serengeti ecosystem. In this case, it was assumed that there is no statistically significant relationship between wildebeest population numbers and sustainable tourism development. As with the other migration features, research results indicated a positive relationship between population numbers and sustainable tourism development, rejecting the null hypothesis.
21. 99.
104.
| Ser.# | Category | Target Population | Sample | Adjusted Sample |
| 1 | Government agencies employees | 236 | 4 | 5 |
| 2 | Non-government agencies | 357 | 5 | 8 |
| Employees | ||||
| 3 | Business facilities | 645 | 10 | 15 |
| Owners/Employees | ||||
| 4 | Tourists | 12167 | 179 | 275 |
| 5 | Local community land owners | 1578 | 23 | 36 |
| Totals | 14983 | 221 | 339 | |
| Source: Researcher's Field Data | ||||
| Frequency | Percentage | |
| Returned | 248 | 73.2 |
| Unreturned | 91 | 26.8 |
| Total | 339 | 100 |
| Source: Field data (2021) | ||
| N | Minimum Maximum | Mean | Std. Deviation | |
| 232 | 1 | 5 | 3.24 | 1.352 |
| 232 | 1 | 5 | 3.33 | 1.328 |
| 232 | 1 | 5 | 2.47 | 1.322 |
| 232 | 1 | 5 | 3.92 | 1.223 |
| 232 | 1 | 5 | 3.72 | 1.075 |
| 232 | 1 | 5 | 3.16 | 1.034 |
| 232 | 1 | 5 | 2.96 | 1.058 |
| 232 | 1 | 5 | 3.81 | 1.288 |
| 232 | ||||
| N | Minimum Maximum Mean Std. Deviation | |||
| 232 | 1 | 5 | 4.08 | 1.214 |
| 232 | 1 | 5 | 4.00 | 1.087 |
| 232 | 1 | 5 | 3.81 | 1.334 |
| 232 | 1 | 5 | 3.82 | 1.113 |
| 232 | 1 | 5 | 2.08 | 1.254 |
| 232 | 1 | 5 | 3.85 | 1.157 |
| 232 | 1 | 5 | 2.38 | 1.106 |
| 232 | 1 | 5 | 3.64 | 1.064 |
| 232 | 1 | 5 | 3.44 | 1.035 |
| 232 | 1 | 5 | 2.03 | 1.279 |
| 232 | ||||
| N Minimum | Maximum Mean Std. Deviation |
| N | Minimum Maximum Mean Std. Deviation | |||
| 232 | 1 | 5 | 3.43 | 1.375 |
| 232 | 1 | 5 | 3.75 | 1.138 |
| 232 | 1 | 5 | 3.63 | 1.170 |
| 232 | 1 | 5 | 3.55 | 1.119 |
| 232 | 1 | 5 | 3.83 | 1.179 |
| 232 | 1 | 5 | 2.47 | 1.135 |
| 232 | 1 | 5 | 2.36 | 1.161 |
| 232 | 1 | 5 | 2.35 | 1.164 |
| 232 | 1 | 5 | 2.50 | 1.057 |
| 232 | 1 | 5 | 2.11 | 1.274 |
| 232 | ||||
| Avsustoudevpt | Avmpatt |
| Dependent Variable: Avsustoudevpt |
| the Siana |
| Conservancy group; (2) the Ololai Mutiek or Ololai Mutia |
| market group; (3) Keekorock Lodge group; (4) Sekenani |
| Gate business community group; and (5) the Kenya |
| Wildlife Service and Narok County Government guards |
| group. |
| The Siana Conservancy group was constituted |
| from the Siana Conservancy employees. The |
| conservancy is a local community's conservation effort |
| initiative where a |
| Source: Field Data 2021 |
| V. Conclusions and Recommendations |
| a) Conclusion |
| i. Migratory Pattern and Sustainable Tourism |
| Development |