1. Introduction
t is a well-known fact that trade policy plays a crucial role in ensuring a higher level of output and stable price level. To guarantee a high level of Gross Domestic Product and stable price level, the main focus of the economy should be on exchange rate policy. Therefore, here for monetary policy one way to reach its aim is by having a stable exchange rate. It is widely believed that too highly appreciation of local currency depresses the external demand for domestic goods meaning that the amount of export is affected negatively. But at the same time, with too rapid depreciation of local currency, the exporters are unlikely to get benefit from selling their goods. Having considered all, to control and keep the foreign exchange rate at a desirable level for the economy, it is necessary for each economy to define main influencing factors (determinants) of the exchange rate.
2. II.
3. Literature Review
Since the economic importance of foreign exchange rate will play a desirable factor for trading economies, there has been taken significant emphasis on the study of foreign exchange rate determinants in recent decades. Determinants of exchange rate volatility have frequently been an area of interest for many macroeconomists worldwide. Still, this subject in transition economies remains empirically unexplored. Some of the researches in the cases of other countries will be reviewed in chronological order as follows.
The preliminary interests on this study commenced after the introduction of optimal currency area by R. Mundell [1] in the 1960s and constitution of European Monetary Union where floating exchange rate has been considered an optimal policy for Euro zone. Consequently, majority macroeconomists were involved to examine the factors of exchange rate volatility. One of them, A. Rose et al. [2] reported that the best interference instrument in exchange changes in interest rate which is an independent variable which explains the sensitivity of exchange rate. Whereas, D. Ariccia [3] proved that exchange rate volatility is also affected by financial variables, especially external debt.
'Fisher effect' a theory proposed by Irving Fisher also describes interest rate differential tend to reflect the exchange rate expectation. The assumption further illustrates that an expected change in the current exchange rate between any two currencies is approximately equivalent to the differences between the two countries the nominal interest rates for that time [4,5]. Spot exchange rate is expected to change equally but in the opposite direction of the interest rate differential. Thus, the currency of the country with the higher nominal interest rate expected to depreciate against the currency of the country with the lower nominal interest rate, as higher nominal interest rate reflect an expectation of inflation. High real interest rate significantly reduces exchange rate volatility [6].
Madura, J. [7] proved that in the long run, it is not the ideal relationship between exchange rates and inflation rates differential. However, he argued that in the long run, inflation differentials might be used for forecasting of exchange rate volatility. An exchange rate is not only determined by the domestic interest rate, but it is also influenced by the changes in the interest rate by the major world economies. Hence, it may be concluded that in case of a single economy, a negative correlation exists between exchange rate volatility and interest rate [8].
While the focus of the previous literature has been on the effect of exchange rate uncertainty on the incentive impacts on net trade, a few authors have examined the "reverse" relationship on the impacts of international trade on the exchange rate. Mundell's [9] optimal currency area assumptions suggest inverse causality, whereby trade flows stabilize real exchange rate fluctuations, hence reducing real exchange rate volatility. Broda and Romalis [10] state additionally that such causality should be addressed as "?most of the exciting studies have focused on the effects of exchange rate regimes or volatility on trade by assuming that the exchange rate process is driven by exogenous shocks and is unaffected by other variables.
Broad research has been accomplished to check the remittance and exchange rate relationship. During the panel data analysis of 13 Latin American economies over 20 years, Amuedo-Dorantes and Pozo [11] exposed that worker remittance appreciates exchange rates. Also, the researchers claim that doubling the remittances to GDP ratio led to a real exchange rate appreciation above 22%. In a relevant analysis, Barajas et al. [12] disagree that the effect of remittances on exchange rates varies across countries. More lately, Mandelman and Acosta [13, 14 and 15] checked that remittances are a cause of real exchange rate appreciation. Similar results are taken in other panel initiatives conducted by Hassan and Holmes [16]. In contrast, Rajan and Subramanian [17] for instance, argue that remittances do not result in the phenomenon known as the Dutch disease (negative consequences arising from considerable increases in the value of a country's currency from any significant influx of foreign currency into a country).
Lately, Tariq [18] conducted research to examine the correlation of money supply and exchange rate volatility in the case of Pakistan. By empirical evidence, it is concluded that money supply has a reverse relationship with exchange rate volatility. It has also been found that money supply (policy variable) has an inverse relationship with exchange rate volatility. Therefore, to restraint the exchange rate volatility, money supply may be efficient.
4. III.
5. Data Description
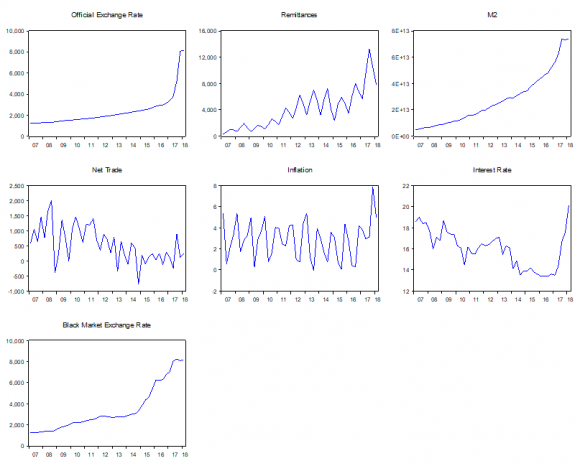
To define exchange rate determinants in Uzbekistan, the study hypothetically sets the following five variables throughout 2007q1-2018q1: money Supply (M2); net export (export-import); inflation; remittances and interest rate (see Table 1). According to the table of the summary statistics, quarterly average official exchange rate ($1 USD=UZS) was equal to approximately 2342 UZS for the period. Indeed, the figure above illustrates that the minimum exchange rate stood at 1243 UZS at the beginning of the selected period, while the maximum exchange rate was 8156 UZS per a US dollar. However, quarterly interest rate and inflation rate fluctuated over the period and made up an average of 16% and 3% respectively. Even though there were some fluctuations in interest rate, its overall trend was downward. The quarterly inflation rate was unstable between 2007q1 and 2018q1. The mean of money supply (M2) during 2007Q1 -2018Q1 was equal to around 27.3 billion per quarter.
According to the summary statistics table, minimum money supply equals 47.2 billion UZS, while maximum M2 was equal to 74.1 billion UZS. Furthermore, the quarterly average of the net export was around 547 million USD. It should be noted that the minimum level of net export for the period was negative, namely 770 million USD, while the highest point was almost 2 billion of US dollars. The last but not least determinant of the exchange rate, the average amount of remittances to the host economy recorded approximately 4.896 billion USD in 2017 and 3.827 billion in 2018Q3 (accumulated).
In general, while exchange rate, money supply (M2) and remittances showed an upward trend during the selected period, interest rate and the amount of net trade in the economy decreased over the time-frame.
Quarterly inflation rate fluctuated over the period ranging from roughly 0 to 8% (See below graph).
6. Empirical Methodology
Since the underlying research aims to define the determinants of the exchange rate in Uzbekistan economy, it initially approaches to the OLS method to analyze and estimate the extent of the abovementioned variables on the exchange rate. Then, due to the presence of non-stationary and heteroskedasticity, the research is also conducted using one of the time-series models ARIMA and ML ARCH respectively.
The current study also approaches some econometric specification tests. Namely, Breusch-Pagan-Godfrey and ARCH tests are applied to determine whether heteroskedasticity or not in the obtained data (see Appendices, Table 1 and Table 2). Breusch-Godfrey Serial Correlation LM Test is used to define whether the residuals are correlated across the series (Table 3). Also, whereas the underlying study carries out the Ramsey test (Table 4) to check whether there is the sign of omitting variable or not, the Chow test (Table 5) is applied for detecting the structural break within the taken period.
In this empirical study, the standard model is as follows: Y = X(0)+C( 1
7. Specification Tests and its Results
It is evident from Table 1 illustrated in the appendices that p-value of the Breusch-Pagan-Godfrey test is not statistically significant meaning that there is insufficient evidence to conclude that variances are not constant across the series. But ARCH test shows that variances are constant across the series and the sum of the ARCH and GARCH coefficients is very close to one. Moreover, when Breusch-Godfrey Serial Correlation LM test was applied, it was found that there is strong firstlevel of autocorrelation (serial correlation) across the residuals. At the same time, to define whether the constructed model has omitted variables or not, the study approaches to the Ramsey test. As it is clear from the p-value, which is equal to almost 0, there is enough evidence to conclude that the constructed model has no omitted variables. Also, to ensure the reliability of the estimates, the study checks whether the data is normally distributed or not, and it found that the residuals are normally distributed by Jarque-Bera (see Table 6 in appendices).
The following table indicates the corresponding coefficients of each regressor included in the model (standard errors of the coefficients in parentheses). Significance levels are depicted by the stars, *p<0.05, **p<0.01 and *** p<0.001 respectively. Before turning to the next section, it is highly essential to note that interpretations of the obtained results will be provided based on the three models, namely OLS, ARIMA, and MARCH. Starting with the OLS model, the obtained results present that the interest rate has no impact on determining the exchange rate in Uzbekistan economy during the period of 2007q1 and 2018q1. This insignificant relationship between exchange rate and the interest rate is also confirmed by the statistics provided by ARIMA and MARCH models at even 1% significance level. Meanwhile, inflation is not found to have a statistically significant effect on the exchange rate by three econometric models namely OLS, ARIMA, and MARCH.
Turning to the discussion of money supply and its impact on the exchange rate, it is clear that money supply (M2) is found to be a essential factor in determining the exchange rate. Specifically, all selected models, namely OLS, ARIMA, and MARCH indicate that a 1% increase in M2 results in approximately 1% depreciation of Uzbek sums against US dollars. Obtaining the same result through using different models highly confirms and increases the reliability of the coefficient obtained. More strikingly, according to the all models above, net trade and exchange rate are positively associated during the selected period. However, the ARIMA model shows that the effect of net trade on rate is statistically insignificant (pvalue 0.519). As previously mentioned in the literature part, the number of remittances and exchange rate are positively correlated meaning that if the inflow of remittances to the host country increases, it leads to the appreciation of local currency. In our empirical analysis, it is found that a 1% rise in the inflow of remittances in USD to Uzbekistan economy should cause roughly 0.24% appreciation of Uzbek sums against US dollars. The underlying correlation is also affirmed by all three models.
8. VI.
9. Conclusion
All in all, while the effects of remittances and money supply on the dynamic of exchange rate are found statistically significant, the impacts of inflation and interest rate are not econometrically meaningful. It is also should be noted that the way the level of net trade influences the exchange rate is not conclusive in our econometric analysis.
Having considered all above, the following might be suggested to policymakers and related parties:
? First of all, Central bank should carefully control the level of money supply (M2) in the economy so that it can keep the exchange rate at an appropriate level for the economy; ? Secondly, all conducted econometric models within the study did not affirm the significance of net trade on the level of exchange rate; it is highly emphasized by other studies as stated in the literature review part that it has its positive impact on shaping the level of exchange rate. Therefore, the responsible parties of the government should highly pay attention to the participation of Uzbekistan workforce in other foreign economies, and redirect their salary to Uzbekistan; ? Thirdly, regardless of the fact that the study did not find strong simultaneous evidence to confirm the sensible effect of the interest rate by commercial banks, at least one model shows a strong negative correlation between commercial interest rate and the level of exchange rate meaning that an increase in interest rate should appreciate UZS against USD;
? Finally, since the study found no credible evidence concerning the effect of inflation on shaping the level of exchange rate, while the goal of the government is keeping an appropriate level of exchange rate, holding the desirable inflation rate should not be at the center of feature to consider.
![)*X1 + C(2)*X2 + C(3)*X3 + C(4)*X4 + C(5)*X5 + µ Where: Y -the logarithm of [exchange rate ($1=UZS)] X0 -constant term X1 -the log of money supply (M2) X2 -inflation rate X3 -the logarithm of remittances in USD X4 -interest rate X5 -the log of net trade in USD µ -error term (disturbance) V.](https://testing.journalofbusiness.org/index.php/GJMBR/article/download/2721/version/101644/2-Determinants-of-Exchange-Rate_html/24209/image-3.png)
| Nominal Exrate_ Official | Rem_S | M2 | Net_Trade | Infl | I_Rate | |
| Mean | 2342.109 | 4044.035 | 2.73E+13 | 547.2689 | 2.877647 | 15.98889 |
| Median | 1914.800 | 3500.145 | 2.32E+13 | 595.1000 | 2.986291 | 16.20000 |
| Maximum | 8156.680 | 13223.96 | 7.41E+13 | 2015.500 | 7.871467 | 20.20000 |
| Minimum | 1243.600 | 356.8818 | 4.72E+12 | -769.0000 | -0.034984 | 13.40000 |
| Std. Dev. | 1485.075 | 2912.185 | 1.95E+13 | 602.3994 | 1.813764 | 1.795857 |
| Skewness | 2.806774 | 0.975118 | 0.951092 | 0.259045 | 0.213938 | 0.133564 |
| Kurtosis | 11.07957 | 3.766163 | 3.068164 | 2.648873 | 2.635516 | 2.188610 |
| Jarque-Bera | 181.4839 | 8.232043 | 6.793035 | 0.734452 | 0.592361 | 1.368210 |
| Probability | 0.000000 | 0.016309 | 0.033490 | 0.692653 | 0.743653 | 0.504542 |
| Sum | 105394.9 | 181981.6 | 1.23E+15 | 24627.10 | 129.4941 | 719.5000 |
| Sum Sq. Dev. | 97039753 | 3.73E+08 | 1.67E+28 | 15966942 | 144.7486 | 141.9044 |
| Observations | 45 | 45 | 45 | 45 | 45 | 45 |
| Explanatory Variables | OLS | ARIMA | ML ARCH |
| I_RATE | |||
| Coefficient | 0.0103 | 0.0103 | -0.0124 |
| Std. error | (0.0153) | (0.0247) | (0.0092) |
| P-value | 0.5030 | 0.675 | 0.1776 |
| INFLATION | |||
| Coefficient | -0.0022 | -0.0022 | -0.0060 |
| Std. error | (0.0131) | (0.0172) | (0.0068) |
| P-value | 0.8654 | 0.896 | 0.3823 |
| M2 | |||
| Coefficient | 1.0073*** | 1.0073*** | 0.8175 |
| Std. error | (0.0823) | (0.1153) | (0.0470) |
| P-value | 0.0000 | 0.000 | 0.0000 |
| NET_TRADE | |||
| Coefficient | 0.0382* | 0.0382* | 0.0317* |
| Std. error | (0.0181) | (0.0592) | (0.0165) |
| P-value | 0.0422 | 0.519 | 0.0554 |
| REMMITTANCE | |||
| Coefficient | -0.2467 | -0.2467 | -0.2039 |
| Std. error | (0.0676) | (0.0731) | (0.0338) |
| P-value | 0.0028 | 0.001 | 0.0000 |
| CONSTANT | |||
| Coefficient | -14.4112 | -14.4112 | 1.4124 |
| Std. error | (1.6076) | (2.6104) | (0.3852) |
| P-value | 0.3850 | 0.000 | 0.0002 |
| R-SQUARED | 0.9549 | 0.9549 | 0.9167 |
| Adjusted R-squared | 0.9492 | 0.9492 | 0.9061 |
| p> F or CHI2 | 0.0000 | 0.0000 | 0.0537 |