1.
A Guide towards Building Effective, Metrics-Driven and Mathematical Sales Segmentation Models for an Enterprise B2b SaaS Business A Practical Guide towards Building an Effective, Metrics-driven Sales Segmentation Model and Analyzing Organizational Shift for an Enterprise B2B SaaS Business Venketesh Iyer ? & Rahul Peravali ?
The paper's goal is to help B2B SaaS companies attain two primary goals -1. Leverage best-in-class business firmographic data for building territory segmentation models 2. Balance the models against the most effective sales metrics, and 3. Understand and optimize for territory disruption year over year due to change in the scale of business. In the paper, we build a model based on the most fundamental building blocks of any SaaS business. The analytical model helps the sales operations, revenue operations and sales departments understand the main drivers of territory disruption and, build balanced territory segments to ensure equitable financial targets for sales reps.
Keywords: sales operations, sales strategy, analytics, territory operations, segmentation, territory carving, sales planning, marketing, customer relationship management, data modeling, data quality, B2B, saas.
2. I.
3. Sales Segmentation Rationale
ales segmentation entails mapping the most experienced and talented sales teams to the specific customer segments they are suited for and thereby establishing distinct marketing techniques to those cohorts. It involves:
1. Identifying segments of your existing and potential customer base with 'like' attributes i.e., industry, geography, size and, allowing your company to maximize its return on investments by tailoring efforts to specific groups. 2. Identifying the most efficient distribution channel. 3. Aligning sales/partner talent based on the complexity of the products and the needs of the segment.
The key goals of territory segmentation are to reduce expenditures made to market to clients who do not want or need your services or products, elevate customer experience and loyalty and minimize attrition.
4. II.
5. Scope Business Model
The scope (business model) that the below strategy best aligns with is B2B direct subscription product sales. The business reflected in the paper is primarily an Enterprise SMB play i.e., the largest of the revenue comes from the smallest of the businesses. The scope of sales territory planning outlined below is limited to certain organizational groups: core and specialist sales teams, sales operations, corporate finance, and any other teams that directly influence sales territory allocation and revenue measurement. While sales have a significant role to play in the curation of the company's GTM strategy-it typically rests within the wheelhouse of sales operations. The revenue and HR organizations contribute heavily to the planning exercise.
6. III.
7. Segmentation Fundamentals
The larger the customer, the more complex the sales cycle. Also, the higher the segment, the lesser the number of customers per sales rep in general, resulting in a pyramid. The largest of the customers are more geographically distributed, and hence one sales rep is often supported by a few local Sales Development Reps (SDRs) / Business Development Reps (BDRs). However, one thing to note here is that coverage also might depend on how important/strategic this customer is and how large of a sales force the company can afford to have. Sometimes companies will have a dedicated sales team serving a single customer depending on their size and revenue share.
There are three broad options for sales territory segmentation. ? Ability to pitch an overall solution to suit the industry needs They are typically implemented where specialized customer orientation knowledge is needed and when the market/industry is rapidly shifting.
8. Option 1 | Geographic Segmentation
The segmentation modeling outlined below is primarily anchored on Option 3 | Market / Customer Segmentation.
The following set of best practices are written with a lens of data that is housed in a CRM environment. The business model that the below strategy best aligns with is B2B direct subscription product sales. The scope of sales territory planning outlined below is limited to certain organizational groups -core and specialist sales teams, sales operations, corporate finance and any other teams that directly influence sales territory allocation and revenue measurement. While sales have a significant role to play in the curation of the company's GTM strategy -it typically rests within the wheelhouse of sales operations. The revenue and HR organizations contribute heavily to the planning exercise.
Assuming the data quality of an organization is optimal, and the sales data is "trusted" and "certified", the two most critical elements of conducting territory segmentation at scale are:
? Identification of the fundamental data attributes that are reflective of the company's go-to market strategy ? Formulating rules to segment customers into "cohorts", on top of this "trusted" data Identification of the fundamental data attributes that are reflective of the company's go-to market strategy.
Every B2B company has a system of record of its customers i.e., businesses. This exercise entails identifying the core data attributes or fields (in the CRM world) that are integral to the company's GTM strategy. For example, a company that sells its product globally, across several industries could have the following attributes of its customer records as building blocks of segmentation:
? Geographical.
? Vertical or Industry or Category of the customer.
? The materiality of the customer to the company -Employees (reflecting size), Seats/Licenses (in case of a subscription model), Revenue (reflecting business), Deal Pipeline (reflecting potential). ? Product adoption.
Formulating RULES to segment customers into "cohorts", on top of this "trusted" data Doing this for the first time is the hardest! It requires numerous conversations and pilots across the sales organization to build trust that "data" can replace some element of "intuition" in territory segmentation. It requires various permutations and combinations of choosing the right attributes and choosing the right level. It is very challenging to get this right in the first year and it is an iterative process for subsequent cycles. BUT it is one of the most efficient techniques that will reward the organization in the longer term and get you a step closer towards an efficient sales planning cycle.
9. Examples
10. IV.
11. Analytical Modeling
There are TWO pillars, a Sales Operations team must in parallel consider:
1. Team-Ensure that each sales rep, frontline manager and leader is successful in headcount management and span of control. 2. Business-Ensure each sales segment defined, is relatively balanced for the revenue potential and open pipeline per sales rep.
Let us take a closer look at the two pillars above. a) Team A successful sales operations team identifies the selling roles needed for the next year and then outlines the core sales rep mapping to each level. A model can look something like below -Segment A being a cohort of the largest customers (could be by either employee size or revenue size):
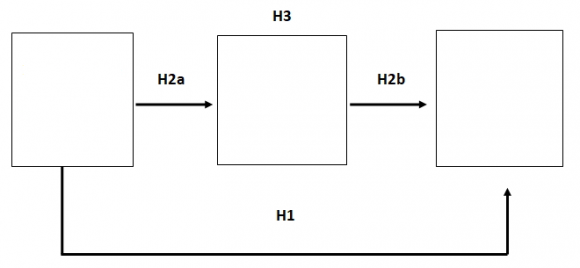
The chart below outlines the ratio of AEs to specific roles within the company and contrasts the same between the current and next year. An AE-Sales Manager ratio of 4:1 means -1 Manager oversees 4
AEs. An AE-Solution Engineer ratio of 6:1 means -6 AEs are supported by 1 SE. b) Insight: As you can see above, the sales rep to manager mapping is fairly balanced across all segments to ensure that the frontline manager is successful and has equitable accountability across the board. Also note the Product Specialist mapping. A single product specialist can offer expertise to multiple sales reps; however, the scale of such support minimizes as the segment gets larger. Realistically, a product specialist can support max. 1-2 enterprise sales reps given the sheer complexity of dealing with larger organizations.
V.
12. BUSINESS
There are many fundamental metrics any sales operations personnel should understand before diving into the Analytical Modeling part.
13. ? Account Executives (AEs) / Client Partners / Sales
Representative -The lead AE running the deal ? Account-A Business/entity ? Customer-A Business/entity with an active contract;
includes free license and revenue-generating accounts.
? Book of Business-List of accounts/customers on which the sales representative is the primary owner (AE). ? Quota-Annual/Quarterly/Monthly revenue target for an AE to attain; a reflection of AEs on their job performance.
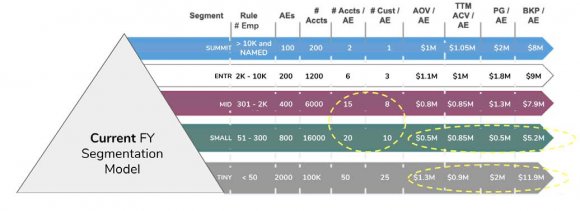
? Seasonality-Scaling factor to set quotas quarterly based on seasonal trends. An annual quota is seldom divided straight by four to compute the quarterly quota. For example, in some businesses, Q1 is the slowest. The Q1 quota might be the lowest of all and the Q4 might be the highest of all. ? Quota Attainment-A percentage computed based on $ value (sum of opportunity amount) of the deals Pre-Segmentation a) Observations One could see that 1. The difference in the book of business (#) per AE is the least between MID and SMALL, but the AOV, PG and, BKP sharply decline. 2. The jump in the average business ($) as well as potential ($) per AE (AOV, PG and, BKP) is large between SMALL and TINY whereas they are balanced for all segments. 3. The TTM ACV/AE remains the same which indicates that the massive spike is attributed towards the later part of the trailing 12 months i.e., very recent.
VII.
14. Conclusions
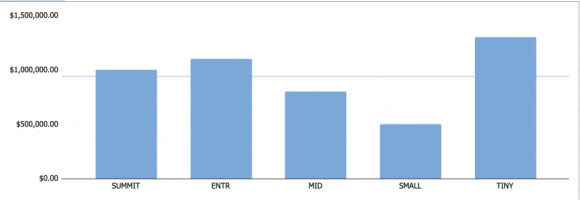
The above observations allude to a few key takeaways 1. The smallest segment TINY carries the largest weight on the AEs. Typically, Account Executives in a small business segment are either at an early stage of their career or do not prefer having complex implementation conversations which entail high dollar value contracts. 2. The SMALL segment has experienced some attrition given the book of business is similar but net revenue faces a sharp dip compared to MID.
15. a) Action
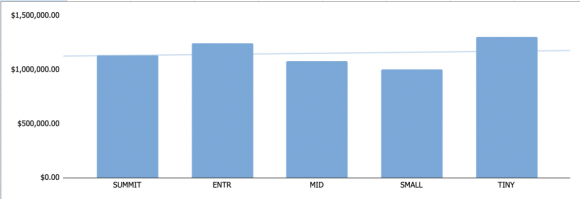
Our conclusions logically point to a few key next steps 1. Expand the lower bound of the SMALL segment i.e., shift inwards the upper bound of/shrink the TINY segment so that more revenue flows into the SMALL segment. This reduces the scale of the jump between SMALL and TINY. 2. Additionally, expand the upper bound of the SMALL segment to minimize the book of business distribution in the MID segment, thereby normalizing the change per segment.
1. Transfer more headcount from SMALL to TINY, to balance out the book of business and potential between the three segments -an important lever from the "TEAM" pillar described earlier. RED FLAG: Transferring AEs to a lower segment can be often perceived as a Demotion. As a result, this option shall not be feasible. 2. Instead, we hire aggressively in the TINY segment.
16. VIII.
17. Segmentation a)
Here is what we are going to do 1. Change the segment line definitions for SMALL, TINY and, MID to below: a. TINY: <40 b. SMALL: 41-325 c. MID: 326-2k d. Make HC changes: e. Hire 300 additional AEs (extra 15% on the base 2000 HC) for the TINY segment. f. Per the ratios described in the TEAM section, hire additional managers or shift coverage necessary (this is out of the scope of this paper).
18. b) A few assumptions
? Assume the same Customer to Account ratio for simplicity ? Linear impact of # accounts on AOV, PG, TTM and BKP ? Uniform net (incl. attritions) HC growth of 15% in all segments except TINY where HC will grow 25% intentionally per the segmentation process and MID + SMALL where there is no net hiring (except for backfills due to the segment line shrinking and the need to maintain balanced patches). ? Assume the industry standard of 20% organic net (including attritions) YoY growth in number of Accounts and Customers (to keep ratios the same)
? Assume industry standard of 30% organic net (including attritions) YoY growth in business i.e., $ AOV, PG, TTM and BKP except for TINY which is assumed to grow at 40% (the smallest of the companies grow the fastest) and SMALL whose % growth is adjusted to 2x i.e., 100% due to an upperbound and lower-bound segment line expansion.
IX. YoY growth and a key insight that the business is shifting towards capturing larger deals. ? The business is not just an SMB play anymore; the company won its first large deal > $3.5M, resulting in a brand-new deal band of $3.5M-5M. ? With all of the above, the primary goal of sales segmentation is to balance simplicity with the everincreasing momentum of the sales organization. ? The larger the company or the faster the company grows, the more convoluted the sales operations process is; such complexity can often depend on the pricing and packaging model, breadth of product offerings, size of the sales organization, revenue recognition process, approval layers, reporting needs, forecasting needs and more. ? Data-driven sales segmentation is not only an effective way to ensure fairness and equitable treatment for the sales organization, but also a very effective way to identify where the company is shifting.
19. Impact and Preliminary Disruption Analysis
20. Global Journal of Management and Business Research
Volume XX Issue V Version I Year 2020 ( )